Results Matlab 6.x

The following bar chart illustrates the relative performance of each of the machines submitted to the benchmarking process. For each machine the average time to complete each of components of the bench routine is plotted as the first 6 bars (smaller is faster). Overall performace is inversely proportional to the total time taken to complete the tests, and is plotted as the 6th bar (pink). The details for each machine labelled A to T are shown below the chart:
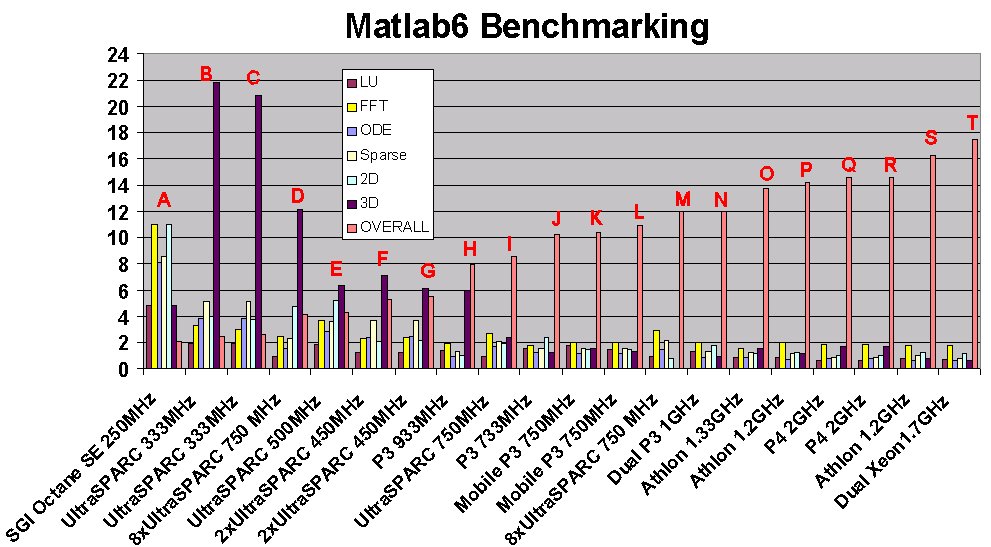
Figure 2: Matlab 6.x benchmark scores. The type and number of processors (UltraSPARC, Intel Pentium (P2/P3/P4)) in the tested machine is shown along the bottom axis. Note: benchmarks D and M are for the same computer. D was obtained whilst displaying the graphical output from the computer across a local network, whilst the results for M were obtained with the user at the console (main difference is in time to complete the graphics benchmarks). Additional details about each machine benchmarked may be found below:
|
ID
|
CPU
|
OS
|
Mem
|
Swap
|
Graphics
|
HD
|
Matlab*
|
"Score"
|
|
A
|
SGI Octane SE 250MHz
|
Irix
|
512
|
512
|
Impact SR
|
SCSI
|
6.0.0.88
|
2.07
|
|
B
|
UltraSPARC 333MHz
|
7
|
384
|
860
|
3D?
|
IDE
|
6.0.0.88
|
2.49
|
|
C
|
UltraSPARC 333MHz
|
7
|
384
|
860
|
3D?
|
IDE
|
6.0.0.88
|
2.60
|
|
D
|
8xUltraSPARC 750 MHz
|
8
|
16384
|
??
|
E3D
|
SCSI
|
12.1
|
4.14
|
|
E
|
UltraSPARC 500MHz
|
8
|
512
|
??
|
3DL
|
IDE
|
12.1
|
4.26
|
|
F
|
2xUltraSPARC 450MHz
|
8
|
1024
|
1024
|
3D?
|
SCSI
|
6.0.0.88
|
5.27
|
|
G
|
2xUltraSPARC 450MHz
|
8
|
1024
|
1024
|
3D?
|
SCSI
|
6.0.0.88
|
5.52
|
|
H
|
P3 933MHz
|
NT5
|
384
|
492
|
EL Erazor
|
IDE
|
12.1
|
7.93
|
|
I
|
UltraSPARC 750MHz
|
8
|
1024
|
2048
|
3D
|
SCSI
|
12.1
|
8.51
|
|
J
|
P3 733MHz
|
W98
|
512
|
512
|
GeF
|
IDE (66)
|
6.0.0.88
|
10.22
|
|
K
|
Mobile P3 750MHz
|
NT5
|
128
|
256
|
ATI
|
IDE
|
SV 12
|
10.41
|
|
L
|
Mobile P3 750MHz
|
NT5
|
384
|
384
|
ATI
|
IDE
|
SV 12
|
10.94
|
|
M
|
8xUltraSPARC 750 MHz
|
8
|
16384
|
??
|
E3D
|
SCSI
|
12.1
|
11.98
|
|
N
|
Dual P3 1GHz
|
NT5
|
2048
|
4092
|
NVQ
|
IDE
|
6.0.0.88
|
11.99
|
|
O
|
Athlon 1.33GHz
|
L(D)
|
512 (DDR)
|
1024
|
G450
|
IDE
|
6.0.0.88
|
13.73
|
|
P
|
Athlon 1.2GHz
|
NT5 (XP)
|
512
|
??
|
EL Gladiac
|
IDE (R0)
|
6.0.0.88
|
14.16
|
|
Q
|
P4 2GHz
|
L(R)
|
2048 (RD)
|
2048
|
NVG2
|
SCSI (160)
|
12.1
|
14.56
|
|
R
|
P4 2GHz
|
L(R)
|
2048 (RD)
|
2048
|
NVG2
|
SCSI (160)
|
12.1
|
14.56
|
|
S
|
Athlon 1.2GHz
|
W98
|
512
|
?
|
EL Gladiac
|
IDE (R0)
|
6.0.0.88
|
16.23
|
|
T
|
Dual Xeon1.7GHz
|
NT5
|
512
|
?
|
NVQ2
|
IDE
|
6.0.0.88
|
17.54
|
Key to Table 2: 7 = Solaris 7, 8 = Solaris 8, I = Irix, L=Linux (D=Debian, R=RedHat), W=Windows 95/98/ME, NT5= Windows 2000/XP. All amounts of physical RAM and swap space (virtual memory) are given in megabytes (Mb), where known the type of PC ram is given: DDR = DDR-RAM, SD = SD-RAM, RD = RDRAM. Graphics cards: 3D = Creator 3D, 3DL = Creator3D Lite, E3D = Elite3D, ATI = ATI Rage Mobility, G450 = Matrox G450, EL = Elsa, GeF = NVidia GeForce256, GeF2 = NVidia GeForce 2 GTS, NVQ = NVidia Quadro, NVQ2 = Nvidia Quadro2. Type of disk interface is given e.g. IDE, SCSI, or IDE/SCSI mix, where known the interface type is given: 66 = UDMA66, 160 = SCSI Ultra160 and the Raid level (R0 = RAID level 0). *Matlab version ("SV" = student version). The final column, "score", is the result from the following calculation:
(1 / (Sum of average times for each of the 6 tests))*100.


